Ice Age Model

freethisone

Re: Ice Age Model
« Reply #325, on November 26th, 2014, 09:53 AM »
STRONG EARTHQUAKE:   of 6.8 or much higher

A strong earthquake hits Molucca Sea  with a moment magnitude of Mw 6.8  at a depth of 46 km (shallow-focus earthquake,3h and 18m ago)  View Location

update,

freethisone

Re: Ice Age Model
« Reply #326, on November 28th, 2014, 10:03 PM »
Electric Field on Earth

The Physics Factbook
Edited by Glenn Elert -- Written by his students
An educational, Fair Use website

topic index | author index | special index

Bibliographic Entry   Result
(w/surrounding text)   Standardized
Result
Cutnell & Johnson. Physics.New York: Wiley, 1995: 583.   "One day the electric field in the atmosphere near ground level is 110 N/C"   110 N/C
Giancoli, Douglas C. Physics, Principles with Applications. 3rd ed. Englewood Cliffs, NJ: Prentice Hall, 1991: 439.   "Measurements indicate the presence of an electric field surrounding the Earth. Its magnitude is about 150 N/C at the earth's surface."   150 N/C
Handbook of Chemistry and Physics. 61 ed. Florida: CRC Press, 1980-81: F-214.   "Volume element at about sea level:
E = 1.2 × 10² V/m
Volume element at about 2 km height:
E = 6.6 × 101 V/m"   120 N/C
66 N/C
Merrill Physics: Principles and Problems. New York: Glencoe, 1995: 444.   "The electric field in the atmosphere is about 150 N/C, downward"   150 N/C
Landa, Judah. How to Study Physics. New York: Jay-El, 1995: 209.   "Near the surface of the earth there exists an electric field whose intensity is 100 N/C directed downward"   100 N/C
The electric field is a measure of the force that is exerted per coulomb of charge. Its measure is defined as kq/r2 where k is the electrostatic constant constant, q is the amount of charge, and r is the distance between charges. The presence of an electric field is identified using a test charge.

The earth's atmosphere has an electric field that is directed radially inward. Most of my sources show that knowing the electric field of the earth can lead to the calculation of the charge on the earth's surface. Though some of the figures obtained are for the earth's atmosphere, it is true that the magnitude of the electric field outside a uniformly charged sphere is the same as if all the charge were concentrated at the center.

I obtained values for the magnitude of the electric field at the Earth's surface. These were in the range of 66 N/C to 150 N/C. These values are close enough to assume that each source received their data from a different primary source and each may be accurate in their own right. I am convinced that the figure is closer to 150 N/C than to 66 N/C because of the sources themselves.

Though the electric field is reported as being constant by some of my sources, The Handbook of Physics and Chemistry proves that the electric field intensity varies measurements taken at different altitudes above sea level. Its intensity decreases as you move farther away from the earth's surface.

Tresha Edwards -- 1998

Bibliographic Entry   Result
(w/surrounding text)   Standardized
Result
Atmospheric Electricity. Grupo de Eletricidade Atmosférica (ELAT). Instituto Nacional de Pesquisas Espaciais. June 2005.   "Over land the average electric field is about 120 V/m …. Assuming an exponential increase of the conductivity with altitude, it can be shown that the electric field decreases exponentially with altitude. At the 30-km level, the electric field is as low as 300 MV/m [sic]. Integrating the electric field from the earth's surface to the ionosphere gives as a result an electric potential difference of about 200 kV."   0.300–120 V/m

freethisone

Re: Ice Age Model
« Reply #327, on December 2nd, 2014, 09:42 AM »
Volcano Activity Summary for 1 Dec 2014:


Currently erupting:
Ambrym (Vanuatu): active lava lakes in several craters (updated 14 Aug 2013)
Aso (Kyushu): intermittent moderate to strong ash emissions (updated 30 Nov 2014)
Bagana (Bougainville Island, Papua New Guinea): ash emissions, lava dome growth (updated 10 Nov 2014)
Bardarbunga (Iceland): lava lake, sporadic fountains, lava flow (updated 18 Sep 2014)
Barren Island (Indian Ocean): intermittent activity, likely strombolian-type and/or lava flows (updated 4 Feb 2014)
Batu Tara (Sunda Islands, Indonesia): strombolian explosions, ash plumes up to 500 m, extrusion of a small lava dome with rockfalls (updated 4 Nov 2014)
Colima (Western Mexico): new lava flow on SW flank (updated 30 Nov 2014)
Dukono (Halmahera): thermal anomaly, probably small explosive activity in summit crater (updated 25 Nov 2014)
Erebus (Antarctica): active lava lake in summit crater (updated 21 Jan 2012)
Erta Ale (Ethiopia): active lava lake in northern pit crater, active hornito with intermittend flow in southern crater (updated 11 Jan 2013)
Fogo (Cape Verde): lava fountaining (updated 30 Nov 2014)
Fuego (Guatemala): strombolian explosions from summit crater, intermittent lava flows (updated 14 Nov 2014)
Ibu (Halmahera, Indonesia): stromolian and phreatomagmatic explosions (updated 14 Nov 2014)
Karymsky (Kamchatka): occasional small explosions, thermal anomaly (updated 4 Oct 2014)
Kilauea (Hawai'i): new lava flow from vents on NE flank of Pu'u 'O'o (updated 13 Aug 2013)
Manam (Papua New Guinea): degassing, occasional ash venting (updated 28 Aug 2013)
Marapi (Western Sumatra, Indonesia): sporadic explosions (updated 27 Mar 2014)
Nasu (Honshu)
Nishino-shima (Volcano Islands, Japan): growing island (updated 11 Oct 2014)
Nyamuragira (DRCongo): active lava lake (updated 29 Nov 2014)
Nyiragongo (DRCongo): active lava lake in summit crater (updated 26 Feb 2014)
Ol Doinyo Lengai (Tanzania): effusion of natrocarbonatite lava inside the crater (updated 8 Jul 2013)
Poas (Costa Rica): phreatic explosions (updated 14 Oct 2014)
Rabaul (Tavurvur) (New Britain, Papua New Guinea): lava fountains, ash emissions from Tavurvur cone (updated 12 Sep 2014)
Reventador (Ecuador): new lava flow on upper NW flank (updated 22 Nov 2014)
Sakurajima (Kyushu, Japan): ash venting, intermittent explosions (updated 30 Nov 2014)
Sangeang Api (Indonesia): growing lava dome & lava flow (updated 7 Jul 2014)
Santiaguito (Guatemala): generation of hot lahars (updated 14 Nov 2014)
Semeru (East Java, Indonesia): growing lava dome, lava flow, strombolian activity (updated 26 Nov 2014)
Shishaldin (United States, Aleutian Islands): mild explosive activity, intermittent more intense phases (updated 24 Nov 2014)
Shiveluch (Kamchatka): growing lava dome, incandescent avalanches, occasional explosions (updated 25 Nov 2014)
Sinabung (Sumatra, Indonesia): continuing pyroclastic flows (updated 19 Nov 2014)
Slamet (Central Java): intense strombolian explosions (updated 13 Sep 2014)
Stromboli (Eolian Islands, Italy): weak strombolian activity at summit vents (updated 22 Nov 2014)
Suwanose-jima (Ryukyu Islands): strombolian activity in summit crater (updated 14 Nov 2014)
Tungurahua (Ecuador): moderate to strong strombolian explosions from central crater (updated 25 Sep 2014)
Turrialba (Costa Rica): occasional ash emissions (updated 17 Nov 2014)
Ubinas (Peru): degassing, sporadic small explosions and ash venting (updated 11 Sep 2014)
Yasur (Tanna Island, Vanuatu): ash emissions, weak strombolian explosions (updated 14 Aug 2013)
Zhupanovsky (Kamchatka, Russia): degassing, last eruption ended mid Oct 2014 (updated 30 Nov 2014)


warnings

Eruption warning / minor activity:
Augustine (Cook Inlet (SW Alaska))
Bezymianny (Central Kamchatka Depression): steaming, weak seismic activity (updated 3 Jul 2014)
Copahue (Chile/Argentina): degassing, crater glow, occasional ash emissions (updated 19 Nov 2014)
Etna (Sicily, Italy): sporadic weak ash emissions from New SE crater (updated 19 Apr 2014)
Heard (Australia, Southern Indian Ocean): possibly lava lake in summit crater (updated 27 May 2014)
Karangetang (Siau Island, Sangihe Islands, Indonesia): incandescent lava dome (updated 24 Oct 2014)
Kavachi (Solomon Islands): no eruption since 2007 (updated 16 Jun 2014)
Kerinci (Sumatra): seismic unrest (updated 5 Jun 2013)
Kirishima (Kyushu): degassing, alert lowered (updated 25 Oct 2014)
Krakatau (Sunda Strait, Indonesia): degassing (updated 31 Mar 2014)
Kuchinoerabu-jima (Ryukyu Islands): explosion on 3 Aug 2014 (updated 21 Aug 2014)
Lokon-Empung (North Sulawesi, Indonesia): small explosions, lava flow? (updated 13 Sep 2014)
Mayon (Luzon Island): extrusion of viscous lava flow, warning of possible explosive eruption (updated 14 Nov 2014)
Medvezhia (Kurile Islands, Russia): strong steaming, thermal anomaly (updated 17 Jan 2013)
Monowai (Kermandec Islands, New Zealand): frequent submarine eruptions, last confirmed during Oct 2014 (updated 14 Nov 2014)
Ontake-san (Honshu): strong phreatic (?) explosion on 27 Sep 2014 (updated 14 Nov 2014)
Pacaya (Guatemala): weak strombolian activity (updated 14 Nov 2014)
Papandayan (West Java): strong hydrothermal activity, increased seismicity (updated 6 May 2013)
Piton de la Fournaise (La Réunion): short-lived eruption during 21-22 June (updated 5 Nov 2014)
Popocatépetl (Central Mexico): degassing, sporadic explosions, slowly growing lava dome (updated 6 Nov 2014)
Rasshua (Central Kuriles)
Raung (East Java): strombolian activity in summit crater (updated 5 Aug 2013)
Rincón de la Vieja (Costa Rica): phreatic explosions from crater lake (updated 21 Sep 2014)
Sabancaya (Peru): Sabancaya volcano (Peru): phreatic eruption on 25 August (updated 10 Nov 2014)
Sacabaya (Northern Chile, Bolivia and Argentina)
San Cristobal (Nicaragua): possible ash emission on 11 April (updated 12 Apr 2014)
San Miguel (El Salvador): ash emissions, small explosions, increasing tremor (updated 2 Sep 2014)
Sangay (Ecuador): degassing (updated 24 May 2013)
Ulawun (New Britain, Papua New Guinea): degassing, ash venting (updated 5 Aug 2013)

freethisone

Re: Ice Age Model
« Reply #328, on December 2nd, 2014, 09:43 AM »
Past hours earthquakes in the World + Europe (Powered by EMSC)

Datetime (UTC time) Lat. Lon. Mag. Dep. Region (Europe Map) 
2014-12-02 17:11:45 UTC -19.91 -71.12 3.8 36    Off Coast Of Tarapaca, Chile    
2014-12-02 17:05:37 UTC 41.09 15.45 2.7 9    Southern Italy    
2014-12-02 16:49:15 UTC 41.10 15.43 2.7 9    Southern Italy    
2014-12-02 16:44:05 UTC 38.95 42.55 2.8 4    Eastern Turkey    
2014-12-02 16:32:45 UTC 51.94 -171.62 4.7 90    Fox Islands, Aleutian Islands    
2014-12-02 16:09:22 UTC -22.41 -68.63 3.6 121    Antofagasta, Chile    
2014-12-02 15:39:48 UTC -20.81 -68.97 2.7 102    Tarapaca, Chile    
2014-12-02 15:36:21 UTC 32.86 -96.90 2.7 5    Northern Texas    
2014-12-02 15:07:41 UTC -34.83 -71.77 3.5 38    Libertador O'higgins, Chile    
2014-12-02 14:48:55 UTC 38.10 22.09 2.7 53    Greece    
2014-12-02 14:43:53 UTC 39.46 -122.67 2.9 4    Northern California    
2014-12-02 14:31:03 UTC 36.17 -97.26 2.5 4    Oklahoma    
2014-12-02 14:25:38 UTC 17.96 -66.87 2.6 9    Puerto Rico    
2014-12-02 14:11:23 UTC 38.63 23.40 2.4 11    Greece    
2014-12-02 13:51:12 UTC 22.12 -108.31 4.3 10    Off Coast Of Baja California Sur    
2014-12-02 13:29:52 UTC -7.83 128.03 4.7 10    Kepulauan Barat Daya, Indonesia    
2014-12-02 13:15:34 UTC 41.09 15.44 2.8 9    Southern Italy    
2014-12-02 13:00:43 UTC 38.20 20.57 3.5 18    Greece    
2014-12-02 12:40:13 UTC 37.25 -97.62 3.0 5    Kansas    
2014-12-02 12:04:29 UTC 35.70 -97.37 3.6 5    Oklahoma    
2014-12-02 11:25:35 UTC 41.85 -119.62 2.3 5    Nevada    
2014-12-02 11:22:53 UTC 39.24 26.29 2.6 5    Near The Coast Of Western Turkey    
2014-12-02 10:42:41 UTC 18.87 -64.31 2.8 24    Virgin Islands Region    
2014-12-02 10:30:58 UTC 24.72 121.71 4.2 76    Taiwan    
2014-12-02 09:49:10 UTC -0.10 97.42 4.9 25    Kepulauan Batu, Indonesia    
2014-12-02 09:18:38 UTC 38.82 -122.80 2.3 1    Northern California    
2014-12-02 08:30:01 UTC 18.88 -64.53 2.3 7    Virgin Islands Region    
2014-12-02 07:49:39 UTC 38.64 23.34 2.0 16    Greece    
2014-12-02 07:24:07 UTC 39.33 28.95 2.9 5    Western Turkey    
2014-12-02 07:10:08 UTC 22.36 143.36 4.7 80    Volcano Islands, Japan Region    
2014-12-02 06:16:50 UTC -20.85 -178.47 4.5 547    Fiji Region    
2014-12-02 05:55:22 UTC 38.37 21.86 2.6 1    Greece    
2014-12-02 05:48:54 UTC 61.60 4.34 2.5 8    Southern Norway    
2014-12-02 05:26:45 UTC 42.83 13.09 2.5 8    Central Italy    
2014-12-02 05:19:49 UTC -38.18 172.07 5.0 750    Off W. Coast Of N. Island, N.z.    
2014-12-02 05:11:32 UTC 6.20 123.18 6.6 633    Moro Gulf, Mindanao, Philippines    
2014-12-02 05:10:11 UTC 17.80 -66.86 2.9 3    Puerto Rico Region    
2014-12-02 04:53:46 UTC 5.95 61.27 5.4 10    Carlsberg Ridge    
2014-12-02 04:31:35 UTC 13.82 -93.22 4.3 24    Off Coast Of Chiapas, Mexico    
2014-12-02 04:19:29 UTC 45.88 27.17 2.5 30    Romania    
2014-12-02 04:05:04 UTC 34.00 -119.08 2.7 8    Channel Islands Reg., California    
2014-12-02 04:03:08 UTC 41.84 -119.61 2.4 3    Nevada    
2014-12-02 03:56:46 UTC -20.30 -70.93 4.8 15    Offshore Tarapaca, Chile    
2014-12-02 03:23:05 UTC 40.18 25.15 2.5 5    Aegean Sea    
2014-12-02 03:17:01 UTC 36.56 27.35 2.5 12    Dodecanese Is.-turkey Border Reg    
2014-12-02 02:51:08 UTC 48.06 -3.93 2.5 2    France    
2014-12-02 02:22:46 UTC 40.43 26.34 2.8 8    Western Turkey    
2014-12-02 02:18:31 UTC 64.68 -17.77 5.3 2    Iceland    
2014-12-02 02:08:51 UTC 35.46 26.59 2.1 3    Crete, Greece    
2014-12-02 01:56:19 UTC 36.18 35.62 2.5 20    Central Turkey    

  Past hours earthquakes in the World + U.S. (Powered by USGS)

Datetime (UTC time) Lat. Lon. Mag. Dep. Region 
2014-12-02 17:39:18 UTC 34.0013333 -117.615 1.4 4.39    Chino, California    
2014-12-02 17:28:31 UTC 36.373 -114.934 1.9 0.24    Nellis Air Force Base, Nevada    
2014-12-02 17:15:42 UTC 34.108 -117.322 1.3 18.24    San Bernardino, California    
2014-12-02 16:30:08 UTC 35.0438333 -117.663 2.1 0.01    Boron, California    
2014-12-02 16:10:05 UTC 19.4047 -155.279 2.2 1.5    Volcano, Hawaii    
2014-12-02 17:05:02 UTC 36.803833 -121.5251694 2.1 5.09    San Juan Bautista, California    
2014-12-02 17:40:00 UTC 32.8596 -96.8972 2.7 5    Irving, Texas    
2014-12-02 16:31:04 UTC 18.7467 -66.1781 2.1 51    San Juan, Puerto Rico    
2014-12-02 15:09:39 UTC 34.407 -116.4666667 1.4 4.03    Yucca Valley, California    
2014-12-02 16:22:12 UTC 38.8346672 -122.8050003 1.2 2.62    Cobb, California    
2014-12-02 15:53:06 UTC 39.4555016 -122.6695023 2.9 3.48    Upper Lake, California    
2014-12-02 16:30:59 UTC 36.175 -97.2591 2.5 4.525    Perry, Oklahoma    
2014-12-02 16:41:18 UTC 17.9631 -66.8735 2.6 8    Maria Antonia, Puerto Rico    
2014-12-02 17:33:33 UTC 42.7085 -122.4898333 1.1 5    Shady Cove, Oregon    
2014-12-02 16:15:17 UTC 22.1185 -108.3103 4.3 10    San Jose del Cabo, Mexico    
2014-12-02 15:22:55 UTC -7.8342 128.033 4.7 10    Dili, East Timor    
2014-12-02 13:56:04 UTC 38.8216667 -122.8448334 1.2 2.33    The Geysers, California    
2014-12-02 16:06:36 UTC 37.2544 -97.6202 3.0 5    Conway Springs, Kansas    
2014-12-02 17:30:52 UTC 35.6986 -97.3745 3.6 5    Edmond, Oklahoma    
2014-12-02 12:04:36 UTC 32.8176667 -115.4655 1.4 1.62    Holtville, California    
2014-12-02 15:13:16 UTC 41.8503 -119.6241 2.3 5.177    Lakeview, Oregon    
2014-12-02 14:12:30 UTC 18.8689 -64.3125 2.8 24    Road Town, British Virgin Islands    
2014-12-02 10:36:13 UTC -0.1052 97.4376 4.9 26.63    Sikabaluan, Indonesia    
2014-12-02 10:33:06 UTC 38.8231659 -122.793663 1.4 3.34    Cobb, California    
2014-12-02 10:04:05 UTC 38.8233337 -122.7953339 2.3 0.04    Cobb, California    
2014-12-02 13:55:44 UTC 18.8796 -64.5341 2.3 7    Road Town, British Virgin Islands    
2014-12-02 08:23:09 UTC 33.1706667 -115.9861667 1.1 4.64    Salton City, California    
2014-12-02 09:34:04 UTC 36.7459984 -120.9215012 1.2 4.86    South Dos Palos, California    
2014-12-02 15:12:35 UTC 22.3423 143.3295 4.7 84.07    Farallon de Pajaros, Northern Mariana Islands    
2014-12-02 14:19:21 UTC -20.8516 -178.4707 4.5 547    Ndoi Island, Fiji    
2014-12-02 06:59:02 UTC 36.6785011 -121.3040009 2.0 4.1    Ridgemark, California    
2014-12-02 09:05:04 UTC 36.6783333 -121.3043365 1.6 3.99    Ridgemark, California    
2014-12-02 08:36:04 UTC 36.0185013 -120.5836639 1.3 4.07    Coalinga, California    
2014-12-02 16:56:24 UTC 6.1375 123.1681 6.3 617.91    Sangay, Philippines    
2014-12-02 13:12:42 UTC 17.801 -66.8553 2.9 3    Guanica, Puerto Rico    

freethisone

Re: Ice Age Model
« Reply #329, on December 2nd, 2014, 09:46 AM »Last edited on December 2nd, 2014, 09:52 AM
Earthquakes
Significant Earthquakes Past 30 Days
6.3
102km WSW of Sangay, Philippines
2014-12-02 05:11:31 UTC617.9 km deep
4.7
12km N of Sedona, Arizona
2014-12-01 05:57:38 UTC10.2 km deep
6.8
156km NW of Kota Ternate, Indonesia
2014-11-26 14:33:43 UTC39.0 km deep
3.3
5km ENE of Irving, Texas
2014-11-23 03:15:47 UTC2.8 km deep
6.2
16km NNE of Omachi, Japan
2014-11-22 13:08:18 UTC10.0 km deep
6.5
122km WNW of Tobelo, Indonesia
2014-11-21 10:10:19 UTC38.1 km deep
4.2
4km S of San Juan Bautista, California
2014-11-20 06:26:49 UTC6.6 km deep
6.7
182km NE of Gisborne, New Zealand
2014-11-16 22:33:20 UTC22.0 km deep
7.1
156km NW of Kota Ternate, Indonesia


location of increasing danger, cause of  the significant effects will follow.

freethisone

Re: Ice Age Model
« Reply #330, on December 5th, 2014, 09:46 AM »Last edited on December 5th, 2014, 09:49 AM
one noted effect  you may have overlooked  https://www.youtube.com/watch?v=6-MAPOFshM0#ws


more proof  kepler 186 and 186F are my brighter than sun object recorded on camera in the reflections 2010.

Scientists say ‘Sibling’ sun found 110 light yrs from Earth
Posted on May 12, 2014 by The Extinction Protocol


May 2014 – UNIVERSE - The sun could have a sibling according to researchers at the University of Texas, who believe the star was born from the same cloud of gas as our sun. It is hoped this could give astronomers fresh insights into how life on earth started. The study was conducted by astronomer Ivan Ramirez, based at the University of Texas, who says that the star is 110 light years away from Earth.  “We want to know where we were born,” Ramirez said in a statement announcing his discovery. “If we can figure out in what part of the galaxy the sun formed, we can constrain conditions on the early solar system. That could help us understand why we are here.” The solar sibling, named HD 162826 by the team that made the discovery, is 15 percent larger than the sun and can be found in the constellation Hercules. It can be seen with the aid of binoculars and is not far from the bright star Vega. Ramirez and his team studied 30 stars that other astronomers believed could be potential solar siblings. He managed to narrow down the list by analyzing the orbit and chemical make-up of each star. His team also included information about the stars’ orbits, where they had been and where they are going in their paths around the center of the Milky Way. After taking all this data into account, they were able to pin point HD 162862 as the sun’s sibling star.

The next step will be to try and find if the star has any planets in its orbit which could support life forms. There is a chance, “small, but not zero,” Ramirez said, that these solar sibling stars could host planets that have life on them. In their earliest days within their birth cluster, he explains, collisions could have knocked chunks off of planets, and these fragments could have traveled between solar systems, and perhaps even may have been responsible for bringing primitive life to Earth. “So it could be argued that solar siblings are key candidates in the search for extraterrestrial life,” Ramirez said. Ramirez said that observatory teams have been monitoring HD 162682 for more than 15 years. However, studies by The University of Texas’ Michael Endl and William Cochran, together with calculations by Rob Wittenmyer of the University of New South Wales, have ruled out any massive planets orbiting close to the star (so-called hot Jupiters), and indicate that it’s unlikely that a Jupiter analog orbits the star. The studies do not rule out the presence of smaller terrestrial planets. The finding of a single solar sibling is intriguing, but Ramirez points out the project has a larger purpose, which could create a road map for how to identify solar siblings, in preparation for the flood of data expected soon from surveys such as Gaia, the European Space Agency mission to create the largest and most precise 3D map of the Milky Way. –RT News


all discovery made after april 2010 are past the date of initial verification by the 2 Italians.

freethisone

Re: Ice Age Model
« Reply #331, on December 5th, 2014, 09:52 AM »
Quote from freethisone on October 4th, 2014, 07:59 PM
In the news in a theater of magic near you... Temple one, and you guessed it heartly 2. before its news. Meet the twins. with a 5.5 yearly comet orbit? here it comes.

Also Known as ISON, Elinin, @ comets that skipped the sun, and  a dozen more names perhaps. Sliding spring, and so on. closest epoch upon us. Feb through July for major natural disasters.

https://www.youtube.com/watch?v=WWfa0ksWptQ#!


https://www.youtube.com/watch?v=WWfa0ksWptQ# :P

free this one images of brighter then sun object 2010 of April.


Also known as Kepler 186 and 186 F ..

freethisone

Re: Ice Age Model
« Reply #332, on December 5th, 2014, 06:22 PM »
Quote from freethisone on December 2nd, 2014, 09:46 AM
location of increasing danger, cause of  the significant effects will follow.
ring ring the bell

M 4.1 - CENTRAL CALIFORNIA - 2014-12-06 02:16:07 UTC
 I felt this earthquake
   Summary    Maps   Testimonies   Pictures   List of data providers   Scientific data    

You felt this earthquake. Tell us!


Magnitude   Ml 4.1
Region   CENTRAL CALIFORNIA
Date time   2014-12-06 02:16:07.4 UTC
Location   36.80 N ; 121.51 W
Depth   6 km
Distances   425 km NW of Los Angeles, United States / pop: 3,792,621 / local time: 18:16:07.4 2014-12-05
198 km S of Sacramento, United States / pop: 466,488 / local time: 18:16:07.4 2014-12-05
11 km SW of Hollister, United States / pop: 34,928 / local time: 18:16:07.4 2014-12-05
6 km SE of San Juan Bautista, United States / pop: 1,862 / local time: 18:16:07.4 2014-12-05

freethisone

Re: Ice Age Model
« Reply #333, on December 6th, 2014, 11:21 PM »Last edited on December 6th, 2014, 11:25 PM
Quote from freethisone on December 5th, 2014, 06:22 PM
ring ring the bell

M 4.1 -
Quote from freethisone on December 5th, 2014, 09:46 AM
one noted effect  you may have overlooked  https://www.youtube.com/watch?v=6-MAPOFshM0#ws


all discovery made after april 2010 are past the date of initial verification by the 2 Italians.
4.9 208km NW of Farallon de Pajaros, Northern Mariana Islands 2014-12-07 00:44:55 UTC-05:00 27.0 km
4.9 146km W of Panguna, Papua New Guinea 2014-12-06 23:44:40 UTC-05:00 10.0 km
2.7 22km SSE of Kettleman City, California 2014-12-06 23:13:20 UTC-05:00 4.6 km
5.7 139km W of Panguna, Papua New Guinea 2014-12-06 22:30:02 UTC-05:00 10.0 km
3.4 25km NNE of Punta Cana, Dominican Republic 2014-12-06 21:42:44 UTC-05:00 45.0 km
5.0 140km WSW of Panguna, Papua New Guinea 2014-12-06 21:24:33 UTC-05:00 10.0 km
3.0 22km SSE of Kettleman City, California 2014-12-06 21:08:48 UTC-05:00 4.6 km
5.2 126km WSW of Panguna, Papua New Guinea 2014-12-06 20:40:05 UTC-05:00 10.0 km
6.8 116km WSW of Panguna, Papua New Guinea 2014-12-06 20:22:00 UTC-05:00 10.0 km
2.7 8km ENE of Morgan Hill, California 2014-12-06 19:42:01 UTC-05:00 2.9 km
2.7 4km SE of Big Pine, California 2014-12-06 19:39:42 UTC-05:00 8.9 km
3.0 43km NE of Mammoth Lakes, California 2014-12-06 19:39:25 UTC-05:00 6.3 km
3.5 42km NNE of Redoubt Volcano, Alaska 2014-12-06 19:12:34 UTC-05:00 110.9 km
2.9 22km SSE of Kettleman City, California 2014-12-06 18:52:53 UTC-05:00 5.5 km
2.7 27km SSE of Medford, Oklahoma 2014-12-06 18:24:29 UTC-05:00 2.1 km
4.5 48km SSE of Teploklyuchenka, Kyrgyzstan 2014-12-06 17:57:23 UTC-05:00 10.0 km
6.0 222km NNW of Saumlaki, Indonesia 2014-12-06 17:05:10 UTC-05:00 117.3 km
2.6 21km SE of Mammoth Lakes, California 2014-12-06 13:49:24 UTC-05:00 15.4 km
6.0 18km E of Punta de Burica, Panama 2014-12-06 12:21:49 UTC-05:00 14.0 km


ring the bell see the link, do you see that crack? here is another contribution to that fault.  6.0 or much much higher.

4.9 208km NW of Farallon de Pajaros, Northern Mariana Islands 2014-12-07 00:44:55 UTC-05:00 27.0 km
4.9 146km W of Panguna, Papua New Guinea 2014-12-06 23:44:40 UTC-05:00 10.0 km
2.7 22km SSE of Kettleman City, California 2014-12-06 23:13:20 UTC-05:00 4.6 km
5.7 139km W of Panguna, Papua New Guinea 2014-12-06 22:30:02 UTC-05:00 10.0 km
3.4 25km NNE of Punta Cana, Dominican Republic 2014-12-06 21:42:44 UTC-05:00 45.0 km
5.0 140km WSW of Panguna, Papua New Guinea 2014-12-06 21:24:33 UTC-05:00 10.0 km
3.0 22km SSE of Kettleman City, California 2014-12-06 21:08:48 UTC-05:00 4.6 km
5.2 126km WSW of Panguna, Papua New Guinea 2014-12-06 20:40:05 UTC-05:00 10.0 km
6.8 116km WSW of Panguna, Papua New Guinea 2014-12-06 20:22:00 UTC-05:00 10.0 km
2.7 8km ENE of Morgan Hill, California 2014-12-06 19:42:01 UTC-05:00 2.9 km
2.7 4km SE of Big Pine, California 2014-12-06 19:39:42 UTC-05:00 8.9 km
3.0 43km NE of Mammoth Lakes, California 2014-12-06 19:39:25 UTC-05:00 6.3 km
3.5 42km NNE of Redoubt Volcano, Alaska 2014-12-06 19:12:34 UTC-05:00 110.9 km
2.9 22km SSE of Kettleman City, California 2014-12-06 18:52:53 UTC-05:00 5.5 km
2.7 27km SSE of Medford, Oklahoma 2014-12-06 18:24:29 UTC-05:00 2.1 km
4.5 48km SSE of Teploklyuchenka, Kyrgyzstan 2014-12-06 17:57:23 UTC-05:00 10.0 km
6.0 222km NNW of Saumlaki, Indonesia 2014-12-06 17:05:10 UTC-05:00 117.3 km
2.6 21km SE of Mammoth Lakes, California 2014-12-06 13:49:24 UTC-05:00 15.4 km
6.0 18km E of Punta de Burica, Panama 2014-12-06 12:21:49 UTC-05:00 14.0 km


Magnitude   Ml 4.1
Region   CENTRAL CALIFORNIA
Date time   2014-12-06 02:16:07.4 UTC
Location   36.80 N ; 121.51 W
Depth   6 km
Distances   425 km NW of Los Angeles, United States / pop: 3,792,621 / local time: 18:16:07.4 2014-12-05
198 km S of Sacramento, United States / pop: 466,488 / local time: 18:16:07.4 2014-12-05
11 km SW of Hollister, United States / pop: 34,928 / local time: 18:16:07.4 2014-12-05
6 km SE of San Juan Bautista, United States / pop: 1,862 / local time: 18:16:07.4 2014-12-05
or much higher      6.0 18km E of Punta de Burica, Panama 2014-12-06 12:21:49 UTC-05:00 14.0 km

sun in response  solar flairs m an x expected to continue bringing major eruptions, and massive quakes.

during torque times delta T the 8.0 will follow.

freethisone

Re: Ice Age Model
« Reply #334, on December 8th, 2014, 03:54 AM »
Quote from freethisone on December 6th, 2014, 11:21 PM
Magnitude   Ml 4.1
Region   CENTRAL CALIFORNIA
Date time   2014-12-06 02:16:07.4 UTC
Location   36.80 N ; 121.51 W
Depth   6 km
Distances   425 km NW of Los Angeles, United States / pop: 3,792,621 / local time: 18:16:07.4 2014-12-05
198 km S of Sacramento, United States / pop: 466,488 / local time: 18:16:07.4 2014-12-05
11 km SW of Hollister, United States / pop: 34,928 / local time: 18:16:07.4 2014-12-05
6 km SE of San Juan Bautista, United States / pop: 1,862 / local time: 18:16:07.4 2014-12-05


or much higher      6.0 18km E of Punta de Burica, Panama 2014-12-06 12:21:49 UTC-05:00 14.0 km

sun in response  solar flairs m an x expected to continue bringing major eruptions, and massive quakes.

during torque times delta T the 8.0 will follow.
Magnitude   Mw 6.5
Region   PANAMA-COSTA RICA BORDER REGION
Date time   2014-12-08 08:54:54.0 UTC
Location   8.05 N ; 82.68 W
Depth   20 km
Distances   259 km SE of San José, Costa Rica / pop: 335,007 / local time: 02:54:54.0 2014-12-08
50 km SW of David, Panama / pop: 82,859 / local time: 03:54:54.0 2014-12-08
21 km E of Punta de Burica / pop: 1,360 / local time: 03:54:00.0 2014-12-08


simply splitting

freethisone

Re: Ice Age Model
« Reply #335, on December 16th, 2014, 06:33 PM »Last edited on December 16th, 2014, 06:35 PM
here is more interesting BS from nasa...

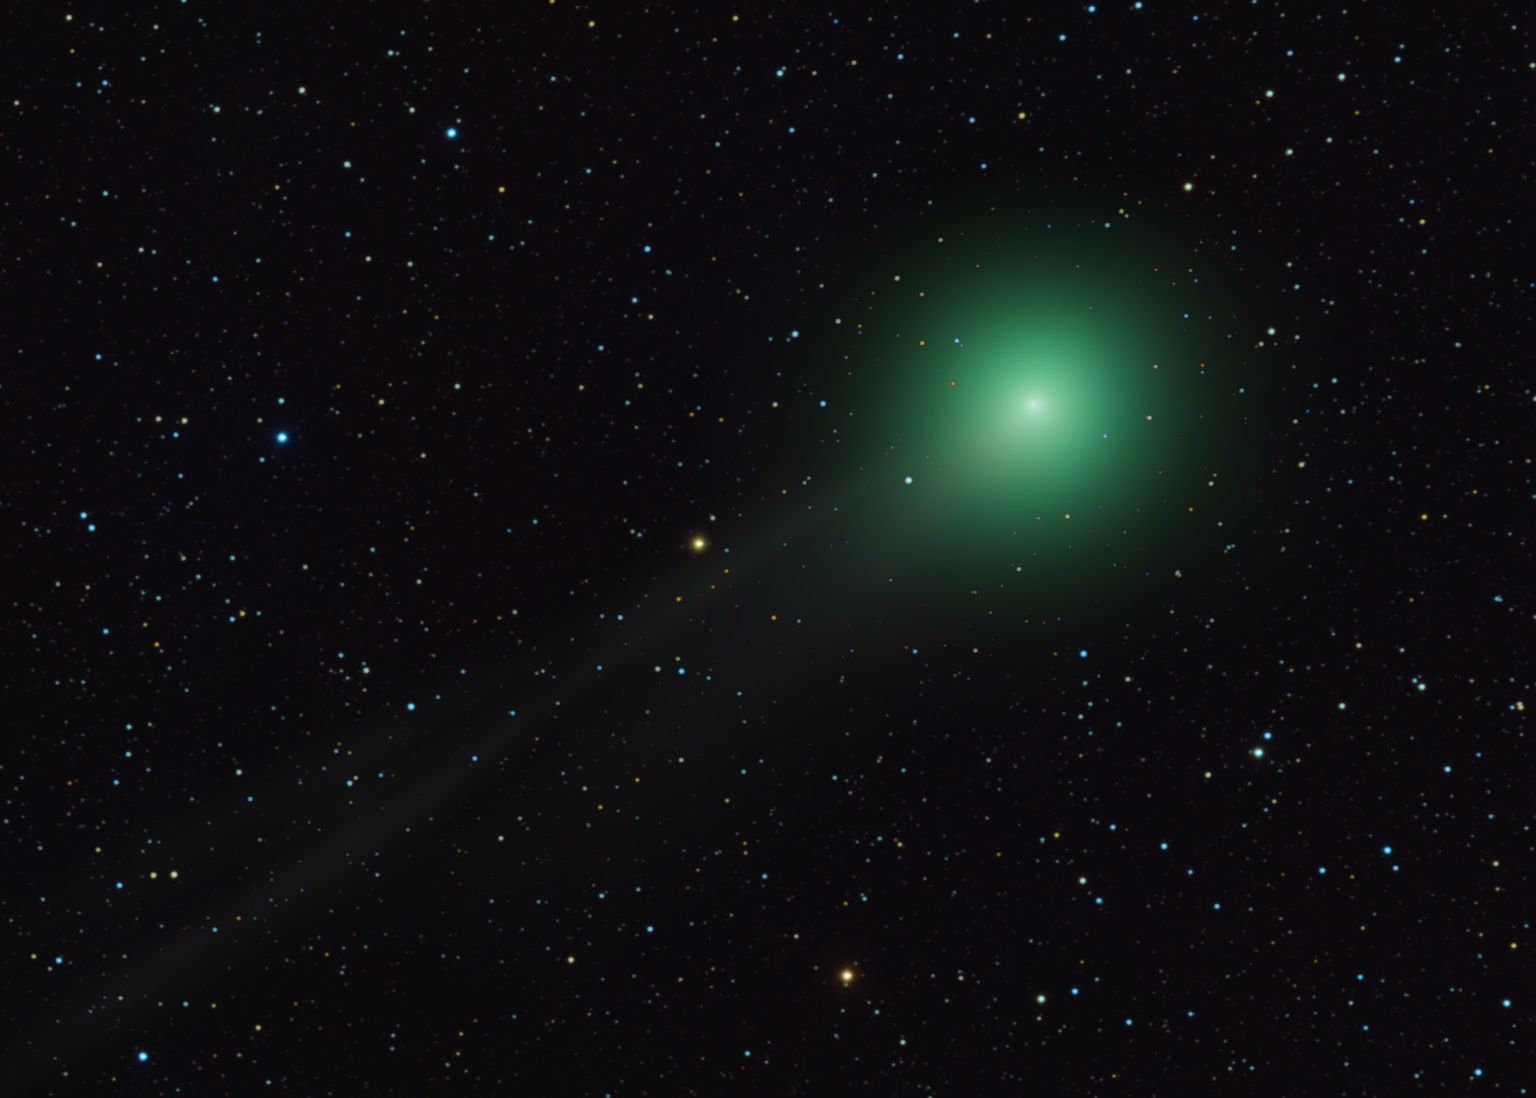
CHRISTMAS COMET: Is there a cylindrical object under your Christmas tree? Open it now. A small telescope is all you need to see Comet Lovejoy (C/2014 Q2). Discovered just a few months ago by Terry Lovejoy in Australia, the green comet is brightening to naked-eye visibility as it moves into northern skies this holiday season. Italian photographer Rolando Ligustri took this picture on Dec. 15th:

"it's amazing how this comet is developing and increasing in brightness," says Ligustri. Indeed, it is brightening faster than experts predicted. Originally the comet was supposed to reach naked-eye visibility in January or February 2015. It may be crossing that threshold now. Reports from the southern hemisphere put the brightness of the comet at magnitude +6.0, similar to the dimmest stars the human eye can see.

On the nights around Christmas, "Comet Q2," as some are calling it, will glide just south of Sirius, the Dog Star. These finder charts from Sky and Telescope can help you find it. Better yet, if that cylindrical object is a GOTO telescope, just plug in the comet's coordinates.


A new Comet Lovejoy, designated C/2014 Q2, is heading our way out of deep space and out of the deep southern sky. It may brighten to 5th magnitude from late December through much of January as it climbs into excellent viewing position for the Northern Hemisphere, high in the dark winter night.

This is Australian amateur Terry Lovejoy's fifth comet discovery. He turned it up at 15th magnitude in Puppis last August, in search images that he took with a wide-field 8-inch scope. It hasn't moved very much since then — it's still in Puppis as of December 11th — but it's hundreds of times brighter now at visual magnitude 6.8, reports David Seargent in Australia. On December 9th "I saw it easily using a pair of 6x35 binoculars," Seargent writes. Using a 4-inch binocular telescope at 25×, he says it was a good 8 arcminutes wide with a strong central condensation and no visible tail.

And it's picking up speed across the sky for a long northward dash.
A Comet of the High Dark

"Comet Q2," as some are calling it, will skim through Columba south of Orion and Lepus from the nights of December 16th through the 26th, brightening all the while, as shown on the finder charts for December and January below and on the print-friendly versions here: December, January. The dates on the charts are in Universal Time, and the ticks are for 0:00 UT.

The comet spends the last few days of December in Lepus at perhaps 6th magnitude, though by then the light of the waxing Moon (at first quarter on the 28th) will start to be an annoyance. On New Year's Eve, a little after January 1st Universal Time, look for the comet just off Lepus's forehead as shown on the charts.

The Moon brightens to become full on January 4th. Most of us won't get a dark moonless view again until early in the evening of January 7th, with the comet now crossing northernmost Eridanus. That's the same day it passes closest by Earth: at a distance of 0.47 a.u (44 million miles; 70 million km). That's also about when it should start glowing brightest for its best two weeks, as it crosses Taurus and Aries high in early evening.

By then the comet is starting to recede into the distance, but its intrinsic brightness should still be increasing a bit; it doesn't reach perihelion until January 30th, at a rather distant 1.29 a.u. from the Sun. By that date the comet should be starting to fade slightly from Earth's point of view. In February it will continue north between Andromeda and Perseus as it fades further, on its way to passing very close to Polaris late next May when it should again be very faint.

Originally Comet Q2 wasn't expected to become this bright. We're basing these predictions on an analysis by J. P. Navarro Pina in late November using the comet's visual behavior for the previous several weeks. Whether it will continue to brighten on schedule is anybody's guess, but the odds are good; comets that don't come near the Sun are more predictable in their brightnesses than those that do.

Q2 is a very long-period comet, but this is not its first time coming through the inner solar system. On the way in, its path showed an orbital period of roughly 11,500 years. Slight perturbations by the planets during this apparition will alter the orbit a bit, so that it will next return in about 8,000 years.


IT stinks because heartley 2 and temple one is not mentioned...  but here it is the same comet over and over again..

:P :P


freethisone

Re: Ice Age Model
« Reply #336, on December 16th, 2014, 06:37 PM »
Elements and Ephemeris for C/2014 Q2 (Lovejoy)
Orbital Elements
The following orbital elements are taken from MPC 89730:

    C/2014 Q2 (Lovejoy)
Epoch 2014 Dec. 9.0 TT = JDT 2457000.5
T 2015 Jan. 30.0823 TT                                  MPC
q   1.290773             (2000.0)            P               Q
z  +0.001483       Peri.   12.3772      -0.1209935      -0.1452554
 +/-0.000053       Node    94.9937      +0.8058287      -0.5920328
e   0.998086       Incl.   80.3021      +0.5796556      +0.7927156
From 145 observations 2014 July 1-Sept. 6, mean residual 0".5.


IT STINKS,,IT IS A  ROTTEN TOMATO! :P :P


JULY 1 2015 WE WILL HAVE A GREAT QUAKE IN JULY<<

freethisone

Re: Ice Age Model
« Reply #337, on December 16th, 2014, 07:48 PM »

EarthSky // Today's Image Release Date: Feb 06, 2013

    25

Comet Lemmon brighter than expected

This comet is visible with binoculars or telescopes now from Earth’s Southern Hemisphere. It’s still getting brighter.

Comet Lemmon as captured by astrophotographer Rolf Wahl Olsen in Auckland, New Zealand on January 28, 2013. View larger. Used with permission. Thank you, Rolf! Visit Rolf’s website here.

This year, 2013, might be called the year of the cometS. Comet PANSTARRS (C/2011 L4) and Comet ISON (C/2012 S1) are being heralded as two comets you might be able to see in 2013 with your unaided eye. In recent months, a third comet has been brightening more rapidly than expected, and now it’s nearing visibility to the eye alone. It’s Comet Lemmon (C/2012 F6), shown in the image above, discovered by Alex Gibbs of the Mount Lemmon survey in Arizona back in March, 2012. At that time the comet was tough to catch even through large telescopes – much too faint to be seen with the eye – at five times Earth’s distance from the sun. But, like the Earth and the other planets in our solar system, comets are bound in orbit by our sun. And as Comet Lemmon has swept into the inner solar system, it has brightened at a rapid rate. If this brightening trend continues, the comet might become visible to the unaided eye this month (February, 2013) through May.

Comet PANSTARRS possibly visible to eye in March 2013

Big sun-diving Comet ISON might be spectacular in late 2013

It is, alas, a Southern Hemisphere object. Sky watchers in the Southern Hemisphere can pick it up in binoculars now. In recent days (early February 2013), visual observers have been estimating the comet at magnitude 6.2 to 6.5. That’s just below the limit for visibility with the unaided eye.

The comet should continue to brighten all month. Who knows how bright it will get? Hopefully bright enough to glimpse with the eye, but probably not as bright as PANSTARRS or ISON. It will be traveling through the far southern constellations of Musca, Octans, Tucana and Phoenix.

Comet Lemmon’s perihelion – or closest point to the sun – will happen on March 24, 2013 at a distance slightly less than that of Earth’s orbit around the sun (0.73 AU). By May, 2013, observers with telescopes in both hemispheres might be able to glimpse it.

See a video of Comet Lemmon, from astrophotographer Rolf Wahl Olsen

Bottom line: In early February 2013, Comet Lemmon (C/2012 F6) is just below the limit of visibility to the unaided eye for observers in the Southern Hemisphere. It should continue to brighten all month. Perihelion is in late March. The comet should be visible to those with telescopes in both hemispheres by May.


lots of green comets with a coma the size of jupiter these days.

freethisone

Re: Ice Age Model
« Reply #338, on December 16th, 2014, 07:51 PM »
who discovered this? BS


Summary
Periodic comet 103P/Hartley 2 is classed as a young, dwarf comet, with a nucleus roughly 2.2 kilometers (1.4 mile) across that rotates once every 18.1 hours. It belongs to the Jupiter family of comets (comets with periods less than 20 years). The comet was discovered in 1986. Although it then had an orbital period of 6.3 years, an analysis of its orbit reveals the period had been longer in the recent past. During the early decades of the 20th century, the orbital period had been 9.3 years. A close approach to Jupiter in August 1947 (0.22 AU) reduced the period to 7.9 years, while another close approach during April 1971 (0.09 AU) reduced the period to 6.1 years. The comet has been seen at every return since its discovery. The 2010 return is exceptional, as the comet will pass 0.12 AU from Earth on October 20. The Deep Impact space craft passed about 1000 kilometers from the comet on November 4.

Discovery
   This image is a digitized section of the actual photographic plate that the comet was discovered upon. The original plate was exposed on 1986 March 15.59 and, after it was developed, Malcolm Hartley (U. K. Schmidt Telescope Unit, Siding Spring Observatory, New South Wales, Australia) noted the diffuse trail of a comet. He estimated the magnitude as 17-18 and added that a faint tail was evident. Further photographic plates were exposed on March 17.68 and 20.61, whereupon Hartley annnounced his discovery to the Central Bureau for Astronomical Telegrams.

freethisone

Re: Ice Age Model
« Reply #339, on December 22nd, 2014, 12:48 AM »Last edited on December 22nd, 2014, 12:51 AM


earthquake swarm, virgin island region, volcanic eruption to follow...

massive 6.7 plus plus hits or much greater. expo star k
torque times delta t..


3.5
11km ESE of Harper, Kansas

2014-12-22 02:45:07 UTC-05:00

5.5 km

3.7
38km SSW of Redoubt Volcano, Alaska

2014-12-22 02:40:19 UTC-05:00

120.5 km

5.8
Pacific-Antarctic Ridge

2014-12-22 02:19:41 UTC-05:00

10.0 km

2.8
78km NNW of Charlotte Amalie, U.S. Virgin Islands

2014-12-22 02:11:09 UTC-05:00

30.0 km

2.8
33km SSW of Anchorage, Alaska

2014-12-22 02:08:18 UTC-05:00

49.8 km

4.3
186km SW of Bella Bella, Canada

2014-12-22 01:51:41 UTC-05:00

13.6 km

2.9
147km W of Newport, Oregon

2014-12-22 01:17:19 UTC-05:00

5.0 km

2.7
75km N of Culebra, Puerto Rico

2014-12-22 01:02:16 UTC-05:00

30.0 km

2.9
80km N of Culebra, Puerto Rico

2014-12-22 01:00:33 UTC-05:00

27.0 km

2.9
71km NNW of Charlotte Amalie, U.S. Virgin Islands

2014-12-22 00:58:32 UTC-05:00

47.0 km

3.0
16km NW of Langston, Oklahoma

2014-12-22 00:05:53 UTC-05:00

5.0 km

3.0
99km NNW of Talkeetna, Alaska

2014-12-22 00:04:34 UTC-05:00

133.9 km

2.8
57km ESE of Road Town, British Virgin Islands

2014-12-22 00:01:04 UTC-05:00

34.0 km

3.2
58km SSE of Boca de Yuma, Dominican Republic

2014-12-21 22:44:04 UTC-05:00

63.0 km

3.8
15km ENE of Cherokee, Oklahoma

2014-12-21 22:40:57 UTC-05:00

5.0 km

2.6
76km N of Culebra, Puerto Rico

2014-12-21 22:40:07 UTC-05:00

24.0 km

2.8
81km NNW of Charlotte Amalie, U.S. Virgin Islands

2014-12-21 22:20:18 UTC-05:00

31.0 km

4.2
15km NW of Turka, Russia

2014-12-21 22:05:17 UTC-05:00

19.7 km

2.7
78km N of Culebra, Puerto Rico

2014-12-21 21:01:37 UTC-05:00

31.0 km

3.4
137km NNE of Vieques, Puerto Rico

2014-12-21 20:42:25 UTC-05:00

71.0 km

4.7
100km SSE of False Pass, Alaska

2014-12-21 20:31:54 UTC-05:00

25.3 km

2.9
76km NNW of Charlotte Amalie, U.S. Virgin Islands

2014-12-21 19:50:48 UTC-05:00

30.0 km

2.7
78km N of Culebra, Puerto Rico

2014-12-21 19:27:50 UTC-05:00

30.0 km

2.7
76km N of Culebra, Puerto Rico

2014-12-21 19:14:48 UTC-05:00

39.0 km

3.0
76km NNW of Charlotte Amalie, U.S. Virgin Islands

2014-12-21 18:58:35 UTC-05:00

18.0 km

2.7
83km NNW of Charlotte Amalie, U.S. Virgin Islands

2014-12-21 18:32:59 UTC-05:00

35.0 km

2.8
76km N of Culebra, Puerto Rico

2014-12-21 18:28:15 UTC-05:00

36.0 km

4.7
138km SE of Lolayan, Indonesia

2014-12-21 18:01:03 UTC-05:00

59.4 km

2.8
75km NNE of Luquillo, Puerto Rico

2014-12-21 17:40:42 UTC-05:00

55.0 km

3.0
80km NNE of Luquillo, Puerto Rico

2014-12-21 17:35:13 UTC-05:00

66.0 km

2.7
73km NNW of Charlotte Amalie, U.S. Virgin Islands

2014-12-21 17:17:23 UTC-05:00

51.0 km

3.9
79km NNW of Charlotte Amalie, U.S. Virgin Islands

2014-12-21 17:14:46 UTC-05:00

24.0 km

2.9
76km N of Culebra, Puerto Rico

2014-12-21 17:03:16 UTC-05:00

32.0 km

3.0
76km N of Culebra, Puerto Rico

2014-12-21 16:37:30 UTC-05:00

33.0 km

2.9
72km N of Culebra, Puerto Rico

2014-12-21 16:14:21 UTC-05:00

43.0 km

5.0
47km N of Agrihan, Northern Mariana Islands

2014-12-21 16:13:53 UTC-05:00

134.2 km

3.4
71km SSW of Chernabura Island, Alaska

2014-12-21 16:03:06 UTC-05:00

32.0 km

3.4
22km SSE of Medford, Oklahoma

2014-12-21 13:42:55 UTC-05:00

5.0 km

3.2
22km S of Medford, Oklahoma

2014-12-21 13:36:00 UTC-05:00

5.0 km

4.9
43km SSE of Cayambe, Ecuador

2014-12-21 12:40:40 UTC-05:00

10.0 km

4.7
39km NNE of Shikotan, Russia

2014-12-21 11:51:17 UTC-05:00

117.5 km

4.6
15km WSW of Nagano-shi, Japan

2014-12-21 11:17:06 UTC-05:00

21.2 km

3.3
14km SW of Caldwell, Kansas

2014-12-21 10:44:05 UTC-05:00

1.5 km

2.5
71km ENE of McGrath, Alaska

2014-12-21 10:08:37 UTC-05:00

0.5 km

5.2
155km WNW of Tobelo, Indonesia

2014-12-21 09:18:42 UTC-05:00

62.1 km

4.7
165km NNW of Kota Ternate, Indonesia

2014-12-21 09:01:03 UTC-05:00

50.9 km

5.2
162km WNW of Tobelo, Indonesia

2014-12-21 08:40:42 UTC-05:00

52.6 km

5.3
160km WNW of Tobelo, Indonesia

2014-12-21 08:29:57 UTC-05:00

56.3 km

2.8
14km E of Charlotte Amalie, U.S. Virgin Islands

2014-12-21 08:17:33 UTC-05:00

28.0 km

4.7
9km SSW of San Javier, Chile

2014-12-21 07:36:56 UTC-05:00

78.4 km

2.7
72km SE of Lakeview, Oregon

2014-12-21 06:51:08 UTC-05:00

2.2 km

6.6
157km WNW of Tobelo, Indonesia

2014-12-21 06:34:14 UTC-05:00

54.7 km

4.5
193km SW of Bella Bella, Canada

2014-12-21 05:45:46 UTC-05:00

10.0 km

4.2
22km W of Puerto Madero, Mexico

2014-12-21 05:35:01 UTC-05:00

10.0 km

4.0
190km SW of Bella Bella, Canada

2014-12-21 05:19:49 UTC-05:00

22.2 km

5.2
52km ENE of Hernani, Philippines

2014-12-21 05:00:12 UTC-05:00

35.0 km

4.9
208km SW of Bella Bella, Canada

2014-12-21 04:40:48 UTC-05:00

12.4 km

3.0
73km N of Culebra, Puerto Rico

2014-12-21 04:28:20 UTC-05:00

6.0 km

2.9
3km SSE of Helena, Oklahoma

2014-12-21 03:53:23 UTC-05:00

5.0 km

freethisone

Re: Ice Age Model
« Reply #340, on December 24th, 2014, 02:43 AM »
Fogo volcano (Cape Verde): continuing lava flows

Mon, 22 Dec 17:40

The eruption continues its destructive work: the lava effusion from the vents remains at moderate intensity and feeds various active flows that spread in the Cha Caldera.
While the foremost front that had destroyed Portela and Bangaeira two weeks ago is no longer active, several lateral breakouts continue to spread in the caldera.
Whatever has so far been spared or only partially covered of buildings from the two villages, is being gradually covered by the flows. [less]
[read all]
Fogo volcano (Cape Verde): Lava destruction & photographic documentation by Martin Rietze

Fri, 19 Dec 23:48


Lava cascade during the Fogo eruption (Dec 2014) (copyright: Martin Rietze)
It seems that after a short period of quietening down (9-14 December) the Fogo eruption has regained its strength. This confirms our earlier report of increased emission of sulphur dioxide thought to indicate the rise of a new magma batch.
After nearly 20 years of inactivity, the Pico de Fogo awakened with a violent flank eruption on the 23rd of November 2014. In less than 4 weeks , this eruption has devastated local communities and caused a humanitarian crisis as it forced 1500 local people to flee and it is likely that another 2000 will have to move to temporary shelters. Media coverage of this natural disaster has so far been remarkably small despite the fact that it is Fogo’s largest volcanic eruption in decades, causing more damage to nearby settlements, and in a shorter time, than the 1995 eruption. [less]


this is a pre cursor what is to follow. the next explosives eruptions are expected from various volcanoes of the world.

surely ice age model has proven this is the case, x and m class flairs intensifies over the next 20 days. 7.0 or higher earthquakes are presumed during the same time frame..

freethisone

Re: Ice Age Model
« Reply #341, on December 24th, 2014, 01:16 PM »Last edited on December 24th, 2014, 01:20 PM


as stated CME electrical discharge causes induction here on earth. volcanic eruption will reflect this effect.


source
GROUND CURRENTS IN NORWAY: A CME sideswiped Earth's magnetic field during the early hours of Dec. 23rd. The glancing impact did not spark bright auroras, but it did induce electrical currents in the soils of Norway. "I detected a fantastic CME shock wave on my instruments," reports Rob Stammes of the Polarlightcenter in Lofoten. The CME probably came from the X2-class flare of Dec. 20th


the death star, see doomsday episode..

freethisone

Re: Ice Age Model
« Reply #342, on December 29th, 2014, 04:21 AM »
Datetime (UTC time) Lat. Lon. Mag. Dep. Region (Europe Map) 
2014-12-29 12:09:36 UTC 2.80 125.63 4.6 162    Kepulauan Sangihe, Indonesia    
2014-12-29 11:02:33 UTC 38.89 26.25 2.7 6    Near The Coast Of Western Turkey    
2014-12-29 10:26:31 UTC 31.09 48.48 3.6 8    Western Iran    
2014-12-29 10:17:39 UTC 38.89 26.30 2.5 15    Near The Coast Of Western Turkey    
2014-12-29 09:48:59 UTC 37.26 31.46 2.4 8    Western Turkey    
2014-12-29 09:29:38 UTC 8.67 121.63 6.1 10    Mindanao, Philippines    
2014-12-29 09:13:31 UTC -19.83 -69.02 3.0 101    Tarapaca, Chile    
2014-12-29 09:12:32 UTC 38.86 26.26 2.6 5    Near The Coast Of Western Turkey    
2014-12-29 09:04:37 UTC 38.89 26.28 2.9 12    Near The Coast Of Western Turkey    
2014-12-29 08:42:22 UTC 38.79 43.24 3.0 3    Eastern Turkey    
2014-12-29 08:30:05 UTC 36.36 -97.46 2.8 4    Oklahoma    
2014-12-29 08:24:15 UTC 38.89 26.33 2.6 8    Near The Coast Of Western Turkey    
2014-12-29 08:22:59 UTC 36.56 -121.15 2.4 3    Central California    
2014-12-29 08:18:21 UTC -22.37 -68.90 3.0 103    Antofagasta, Chile    
2014-12-29 08:06:24 UTC 38.91 26.34 4.6 10    Near The Coast Of Western Turkey    
2014-12-29 07:53:27 UTC 35.79 -0.15 3.9 10    Northern Algeria    
2014-12-29 07:48:13 UTC 37.06 -119.29 2.6 39    Central California    
2014-12-29 07:08:34 UTC 18.66 -66.91 2.8 17    Puerto Rico Region    
2014-12-29 06:46:46 UTC 36.83 -7.89 2.3 46    Strait Of Gibraltar    
2014-12-29 06:28:28 UTC 38.34 21.83 2.3 11    Greece    
2014-12-29 06:27:54 UTC -18.13 -178.37 4.9 589    Fiji Region    
2014-12-29 06:24:45 UTC 37.68 37.48 2.2 8    Central Turkey    
2014-12-29 06:03:38 UTC 17.92 -65.45 2.8 12    Puerto Rico Region    
2014-12-29 05:50:34 UTC 38.34 21.81 2.1 9    Greece    
2014-12-29 05:22:24 UTC 36.19 -97.38 2.8 10    Oklahoma    
2014-12-29 05:04:57 UTC 35.79 -121.36 2.8 1    Offshore Central California    
2014-12-29 05:04:12 UTC 18.63 -64.90 3.1 79    Virgin Islands Region    
2014-12-29 02:29:57 UTC 37.88 29.36 2.6 7    Western Turkey    
2014-12-29 02:07:23 UTC 38.40 22.01 2.7 10    Greece    
2014-12-29 01:40:08 UTC 46.14 14.95 2.2 16    Slovenia    
2014-12-29 01:28:54 UTC -33.52 -71.37 3.3 52    Valparaiso, Chile    
2014-12-29 00:52:13 UTC 36.61 22.99 2.2 10    Southern Greece    
2014-12-29 00:24:09 UTC 36.47 -120.39 2.7 14    Central California    
2014-12-29 00:15:38 UTC -15.40 167.64 4.6 120    Vanuatu    
2014-12-29 00:02:13 UTC 35.53 28.44 3.2 20    Eastern Mediterranean Sea    
2014-12-28 23:42:02 UTC 40.57 77.03 4.3 1    Southern Xinjiang, China    
2014-12-28 23:31:22 UTC 39.23 29.37 2.0 6    Western Turkey    
2014-12-28 23:21:04 UTC 44.28 7.33 2.3 10    Northern Italy    
2014-12-28 23:18:50 UTC 67.09 -18.87 4.5 10    Iceland Region    
2014-12-28 22:31:17 UTC 36.97 42.37 2.8 5    Iraq    
2014-12-28 22:27:04 UTC 37.17 28.56 2.9 12    Western Turkey    
2014-12-28 22:21:26 UTC 49.46 -120.48 2.3 19    British Columbia, Canada    
2014-12-28 22:13:23 UTC -31.51 -68.70 4.8 80    San Juan, Argentina    
2014-12-28 22:10:09 UTC -19.37 -69.20 3.2 106    Tarapaca, Chile    
2014-12-28 22:00:58 UTC -34.75 -72.54 3.5 25    Offshore Maule, Chile    
2014-12-28 22:00:49 UTC 39.14 16.62 2.2 19    Southern Italy    
2014-12-28 21:54:55 UTC 39.29 16.38 2.3 10    Southern Italy    
2014-12-28 21:51:02 UTC 39.31 16.43 2.0 11    Southern Italy    
2014-12-28 21:46:22 UTC 39.29 16.42 3.3 10    Southern Italy    
2014-12-28 21:43:39 UTC 39.29 16.36 4.7 11    Southern Italy    

  Past hours earthquakes in the World + U.S. (Powered by USGS)

Datetime (UTC time) Lat. Lon. Mag. Dep. Region 
2014-12-29 11:57:08 UTC 19.4065 -155.2912 1.9 4.5    Volcano, Hawaii    
2014-12-29 12:18:03 UTC 36.0115013 -120.5728302 2.0 4.31    Coalinga, California    
2014-12-29 11:23:27 UTC 63.3402 -150.1157 1.5 0.5    Cantwell, Alaska    
2014-12-29 10:55:17 UTC 18.992 -155.4297 2.4 30.6    Pahala, Hawaii    
2014-12-29 10:41:11 UTC 65.9331 -150.5142 2.8 8.3    Manley Hot Springs, Alaska    
2014-12-29 10:22:02 UTC 35.5950012 -120.7898331 1.6 4.02    Paso Robles, California    
2014-12-29 09:49:07 UTC 34.7926667 -116.3496667 1.4 7.59    Baker, California    
2014-12-29 09:35:23 UTC 45.3381653 -121.6855011 2.1 4.79    Mount Hood Village, Oregon    
2014-12-29 11:37:28 UTC 8.602 121.5041 6.1 37.85    Cagayancillo, Philippines    
2014-12-29 09:19:43 UTC 38.8173332 -122.8008347 1.1 2.04    The Geysers, California    
2014-12-29 09:17:08 UTC 36.4356651 -121.2330017 1.5 20.48    Soledad, California    
2014-12-29 09:31:55 UTC 64.984 -149.4677 1.4 20    North Nenana, Alaska    
2014-12-29 09:14:04 UTC 39.3161659 -122.796669 2.1 0    Upper Lake, California    
2014-12-29 09:18:09 UTC 63.0527 -150.5266 2.1 96.9    Talkeetna, Alaska    
2014-12-29 10:40:17 UTC 36.3602 -97.4598 2.8 3.8    Perry, Oklahoma    
2014-12-29 12:02:02 UTC 36.5589981 -121.1463318 2.4 3    Soledad, California    
2014-12-29 11:14:03 UTC 36.5551682 -121.1486664 1.3 6.8    Soledad, California    
2014-12-29 08:26:47 UTC 38.9353 26.264 4.3 10    Plomarion, Greece    
2014-12-29 10:45:06 UTC 37.0629997 -119.2923355 2.6 39.06    Auberry, California    
2014-12-29 08:03:28 UTC 18.6636 -66.9115 2.8 17    Quebradillas, Puerto Rico    
2014-12-29 07:43:51 UTC 65.1652 -149.0158 1.7 7.2    Ester, Alaska    
2014-12-29 08:58:17 UTC 39.6615 -112.0028333 3.2 1.44    Nephi, Utah    
2014-12-29 06:58:15 UTC 60.0276 -141.1725 1.7 1.3    Cape Yakataga, Alaska    
2014-12-29 06:45:08 UTC -17.9738 -178.439 4.7 584.93    Lambasa, Fiji    
2014-12-29 06:51:05 UTC 38.777668 -122.7278366 1.7 2.19    The Geysers, California    
2014-12-29 11:19:51 UTC 39.6658333 -111.9665 3.7 1.66    Nephi, Utah    
2014-12-29 08:02:17 UTC 17.9181 -65.4483 2.8 12    Esperanza, Puerto Rico    
2014-12-29 06:34:02 UTC 39.9864998 -120.1248322 2.2 0.24    Portola, California    
2014-12-29 06:03:35 UTC 34.2426667 -117.4945 1.4 9.52    Muscoy, California    
2014-12-29 06:14:31 UTC 36.1867 -97.3793 2.8 10.1    Perry, Oklahoma    
2014-12-29 05:37:02 UTC 35.7891655 -121.3580017 2.8 0.03    San Simeon, California    
2014-12-29 08:01:42 UTC 18.6292 -64.8974 3.1 79    Charlotte Amalie, U.S. Virgin Islands    
2014-12-29 05:18:11 UTC 62.1382 -148.6874 1.1 48.8    lpine, Alaska    
2014-12-29 05:04:03 UTC 61.6052 -149.7944 1.7 38    Houston, Alaska    
2014-12-29 04:40:58 UTC 33.764 -115.9308333 1.0 1.1    Thermal, California 


waiting for much larger 20 days out 7.0 plus volcanic eruption eminent.

freethisone

Re: Ice Age Model
« Reply #343, on December 29th, 2014, 09:55 PM »
COMET LOVEJOY BRIGHTENS: It's official.


Our brighter then sun object kepler 186F temple one comet..  not>>>> O:-)


 Comet Lovejoy (C/2014 Q2) is now a naked-eye object. Science journalist and longtime comet watcher Mariano Ribas of the Planetario de la Ciudad de Buenos Aires, Argentina, reports that "Comet Lovejoy has reached magnitude 5.0, just above the threshold for human visibility from dark-sky sites. Even in the light polluted sky of Buenos Aires, the comet is a very easy object in 10x50 binoculars."

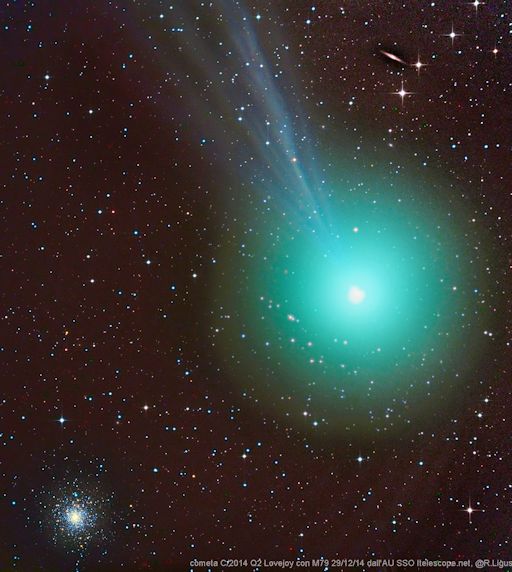
Last night, Italian astrophotographer Rolando Ligustri used a remotely-controlled telesope in Australia to capture this image of the comet passing by star cluster M79:

Alan Dyer, author of the e-book How to Shoot Nightscapes and Timelapses, confirms the comet's growing brightness: "From my dark observing site near Silver City, New Mexico, the comet was visible to the naked eye on Dec. 27-28, though only if you knew just where to look."

Roughly speaking, the comet is passing south of the constellation Orion. Finder charts from Sky & Telescope will help you find it in the midnight sky. For accurate pointing of telescopes, an ephemeris from the Minor Planet Center is available.

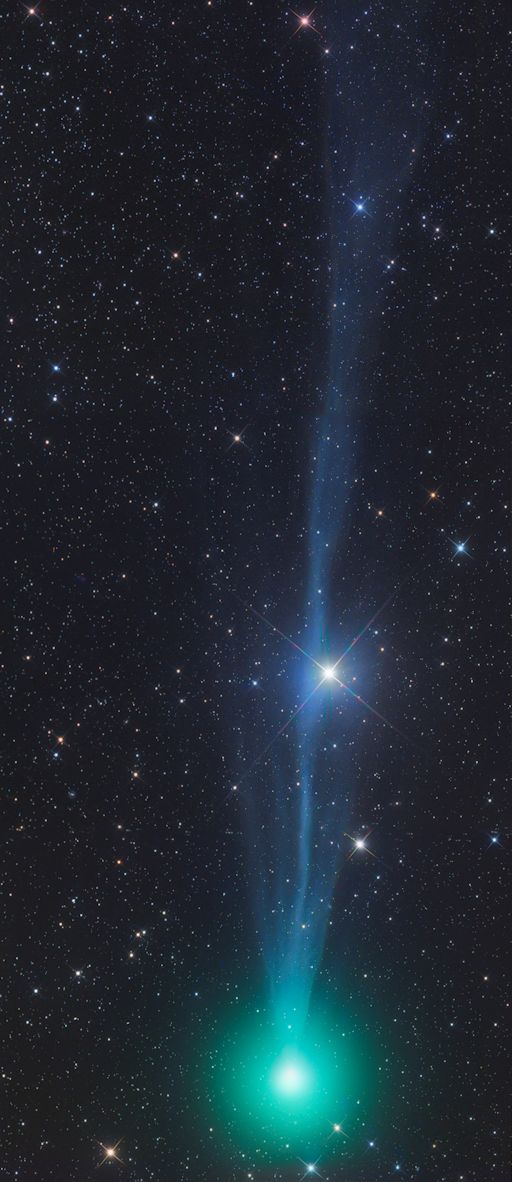
For astrophotographers interested in "beauty shots," Comet Lovejoy has a marvelous pallette. The sinuous blue ion tail both contrasts and compliments the comet's puffy green atmosphere. These colors come from ionized carbon monoxide (CO+) and diatomic carbon (C2), which glow blue and green, respectively, in the near-vacuum of interplanetary space.

"Looking the behaviour of this comet over the past month, I think that it will brighten to magnitude 4.5 or even 4.0 in the first week of 2015," predicts Ribas. If so, the show has just begun. Stay tuned for updates.

freethisone

Re: Ice Age Model
« Reply #344, on January 2nd, 2015, 02:15 PM »


taken what was learned in 2010 and 2011 of objects of high brightness.  the position of this increasing potential shows us it is this object in question.

remember corral castle  Spika star. .observations are in order with vector potential, in this direction. coming right out of the black board. therefore it is true we also have debris associated with it.  Could it be that Spika is this star? kepler 186?  :huh:


 Meteors from a Shattered Comet:
the Quadrantids
Spaceweather.com
   
Global Notes: This is a northern hemisphere shower.


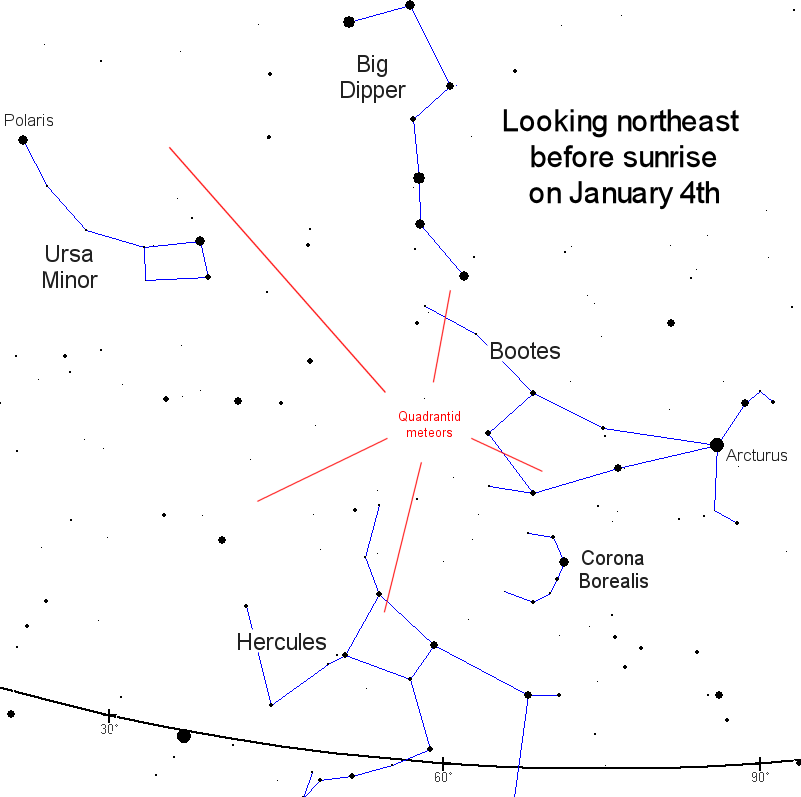
The Quadrantid meteor shower is one of the year's best, often producing more than 100 meteors per hour from a radiant near the North Star. In 2012 forecasters expect the shower to peak around 07:20 UT (02:20 am EST) on Wednesday, January 4. The peak is brief, typically lasting no more than an hour or so, and it does not always occur at the forecasted time, so observers are encouraged to be alert for meteors throughout the early hours of January 4th.

Although the Quadrantids are a major shower, they are seldom observed. One reason is weather. The shower peaks in early January when northern winter is in full swing. Storms and cold tend to keep observers inside.

Above: In 2008, NASA-supported scientists flew an airplane above the clouds and over the Arctic Circle to gain a good view of the shower. Jeremie Vaubaillon of Caltech recorded these Quadrantids streaking through the aurora borealis outside the window of the plane.


Another reason is brevity. The shower doesn't last long, a few hours at most. Even dedicated meteor watchers are likely to miss such a sharp peak. In his classic book Meteor Astronomy, Prof. A.C.B. Lovell lamented that "useful counts of the Quadrantid rate were made in [only] 24 Januaries out of a possible 68 between 1860 and 1927. ... The maximum rate appears to have occurred in 1932 (80 per hour) although the results are influenced by unfavorable weather."

The source of the Quadrantid meteor shower was unknown until Dec. 2003 when Peter Jenniskens of the NASA Ames Research Center found evidence that Quadrantid meteoroids come from 2003 EH1, an "asteroid" that is probably a piece of a comet that broke apart some 500 years ago. Earth intersects the orbit of 2003 EH1 at a perpendicular angle, which means we quickly move through any debris. That's why the shower is so brief.

Quadrantid meteors take their name from an obsolete constellation, Quadrans Muralis, found in early 19th-century star atlases between Draco, Hercules, and Bootes. It was removed, along with a few other constellations, from crowded sky maps in 1922 when the International Astronomical Union adopted the modern list of 88 officially-recognized constellations. The Quadrantids, which were "re-zoned" to Bootes after Quadrans Muralis disappeared, kept their name--possibly because another January shower was already widely-known to meteor watchers as the "Bootids."

Got clouds? No problem. You can stay inside and listen to the Quadrantids. Tune into SpaceWeather Radio for a live audio stream from the Air Force Space Surveillance Radar. When a Quadrantid passes over the facility, you will hear a "ping" caused by the radar's powerful transmitter echoing from the meteor's ion trail. During the shower's peak, the soundtrack is guaranteed to entertain.


freethisone

Re: Ice Age Model
« Reply #348, on January 3rd, 2015, 01:50 AM »
basically Matt the ice age model predicted one thing, that one thing was (expo star k) = external net force precession.the only one possible cause for axis shift starting in 2010. read a problem in dynamics James clerk Maxwell. you have not responded to the master himself, who like Walter lewin is an astronomer.i had told you of a background story that the old masons visited king Solomon and they received this information first hand

what is free mason? well ed Lee Grand dad was a freemason, the old man had told his grand son this.was the case. Ed lee used secret information to construct the corral castle

the new star of Bethlehem..seen in the east sure its the same thing. therefore we have Mira star, and Spika star, and we have these objects associated with them.

what this shows is there is life outside this world. that is due to the artificial satellite observed, that i had compared to star trek.. to prove dates are also known i refer again to the number on the enterprise. 1701, or jan 2017. is this significant in the story of uncovering truth?  we shall see.

how is temple one comet also predominant in this same situation? it is a new comet with a 6 year orbital period to our sun. Is this really true? a 6 year period comet?  why has the same images of these same comets over the last 7 years or so been called by many names? i had said Kepler 186 and 186 f is our objects in question. i use modern day dATA TO PROVE MY PHYSICS POINT. THAT IS HOW I HAD PREDICTED ALL OF THE GREAT QUAKES AS OF 2011. many other 7.0 plus predictions are spot on. this is not due to luck.its due to the position of said system of objects of high mass, and charge, this also proved to be a fact.

what questions could you possibly have?

freethisone

Re: Ice Age Model
« Reply #349, on January 3rd, 2015, 02:06 AM »Last edited on January 3rd, 2015, 02:12 AM
Quote from freethisone on June 12th, 2014, 06:48 PM
http://www.swpc.noaa.gov/rt_plots/Xray.gif


Again this is a spark gap trigger, the sun suddenly goes into discharge. in this case the time frame was predictable. now we wait, :dodgy:
Quote from freethisone on June 3rd, 2014, 02:07 PM
let me show u again, how star trek  has information all along.

1701 is the space ship..   01-2017? any how i showed u pictures in the past, but are deleted after the forum change over to sanka..

now i have 3 stars, and a A far out u may say? but have you also seen my other discovery? a skull pyramid on mars. wow... mars needs moms freethisone.


i have named these objects the twins, temple one heartly 2. :dodgy:


Real data, and information, years worth..


Mars Baby..

https://www.youtube.com/watch?v=szvroCtqhxk#ws